
echarts系列之 - 中国地图
echarts地图的应用,有关echarts中国地图区域的实现
echarts实现中国地图
效果图:
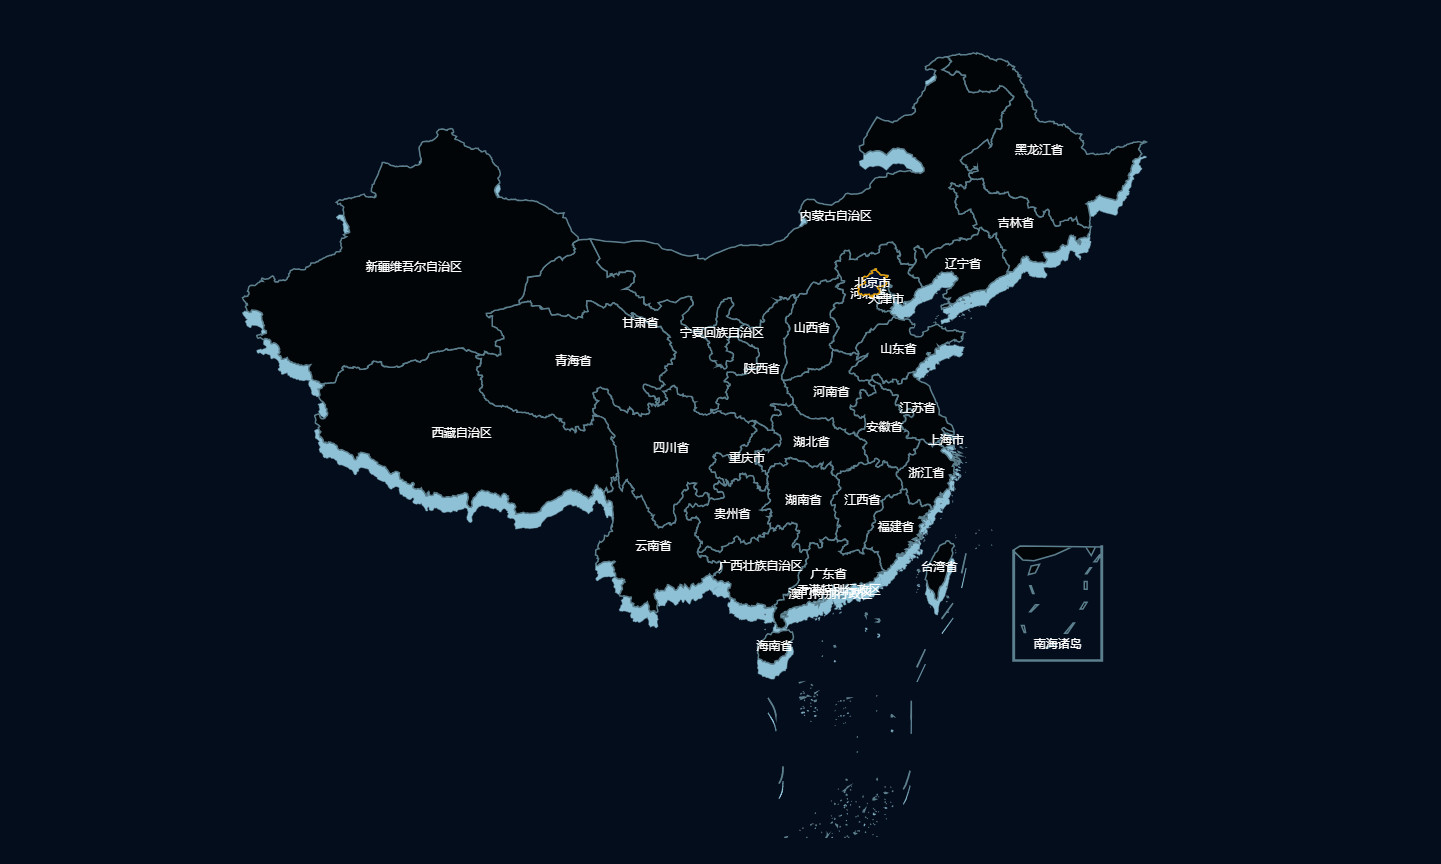
说明:
该效果为简单的中国区域图,在下方的代码中无法支持它实现点击某个城市后放大显示当前城市的操作?。
前提准备:
该效果基于Vue2 + Echarts实现,所以您应该满足以上条件。
V u e 请 参 考? https://cn.vuejs.org/guide/introduction.html
Echarts请参考 ? https://echarts.apache.org/zh/index.html
中国JSON数据 ? https://pan.quark.cn/s/1f91f6dce387
Echarts的安装:
cnpm i echarts -S
代码:
china.json 的数据来源于上面的中国JSON数据
<template>
  <div class="mapBox">
    <div ref="refMap" id="refMap" class="maps"></div>
  </div>
</template>

<script>
import * as echarts from 'echarts';

import chinaMap from './china.json';

export default {
  data() {
    return {
      myChart: undefined,
      cityPointSet: chinaMap.features.map((r) => ({
        name: r.properties.name,
        center: r.properties.center,
        centroid: r.properties.centroid,
      })),
      cityPoint: [],
    };
  },
  methods: {
    drawMap() {
      echarts.registerMap('china', { geoJSON: chinaMap });
      const myChart = echarts.init(document.getElementById('refMap'));

      const option = {
        geo: {
          map: 'china',
          aspectScale: 0.85,
          layoutCenter: ['50%', '56%'],
          layoutSize: '113%',
          itemStyle: {
            normal: {
              shadowColor: '#8ec1d6',
              shadowOffsetX: 0,
              shadowOffsetY: 15,
              opacity: 1,
            },
            emphasis: {
              areaColor: '#276fce',
            },
          },
          regions: [{
            name: '南海诸岛',
            itemStyle: {
              areaColor: 'rgba(0, 10, 52, 1)',
              borderColor: 'rgba(0, 10, 52, 1)',
              normal: {
                opacity: 0,
                label: {
                  show: false,
                  color: '#009cc9',
                },
              },
            },
            label: {
              show: false,
              color: '#FFFFFF',
              fontSize: 12,
            },
          }],
        },
        series: [
          // 常规地图
          {
            type: 'map',
            mapType: 'china',
            aspectScale: 0.85,
            // 地图位置
            layoutCenter: ['50%', '56%'],
            layoutSize: '113%',
            zoom: 1,
            roam: false,
            scaleLimit: {
              min: 1,
              max: 2,
            },
            // 各区域名称样式配置
            itemStyle: {
              normal: {
                areaColor: '#010508',
                borderColor: '#5c7f8e',
                borderWidth: 1.5,
                label: {
                  show: true,
                  color: '#fff',
                },
              },
              // 区域选中后的配置
              emphasis: {
                areaColor: '#02102b',
                borderColor: '#e49e03',
                label: {
                  show: true,
                  color: '#fff',
                },
              },
            },
            select: {
              itemStyle: {
                areaColor: '#010508',
                borderColor: 'yellow',
              },
              label: {
                show: true,
                color: '#fff',
              },
            },
            data: [],
          },
        ],
      };

      myChart.setOption(option);
      this.myChart = myChart;
      // 默认选中第一项区域高亮
      this.myChart.dispatchAction({
        type: 'highlight',
        seriesIndex: 0,
        dataIndex: 0,
      });
    },
  },
  mounted() {
    setTimeout(() => {
      this.drawMap();
    }, 200);
  },
};
</script>

<style>
*{
  margin: 0;
  padding: 0;
}
.mapBox{
  width: 100%;
  height: 100vh;
  background: #040d1c;
  display: flex;
  align-items: center;
  justify-content: space-around;
  color: #fff;
}
.maps{
  width: 927px;
  height: 800px;
}

</style>
?如果感觉本文章对您有所帮助的话,点个赞吧~?