
基于Echarts实现ECG心电图
基于Echarts实现ECG波形心电图效果
ECG心电图
前言:
因项目需要,要实现一个动态ECG效果,但在网上查询后发现不管是echarts社区和其它论坛上现成的心电图效果都没有添加基线和循环更新,都是在数据后面进行无限叠加的,所以基于此借助echarts实现了一个简易版动态心电图。
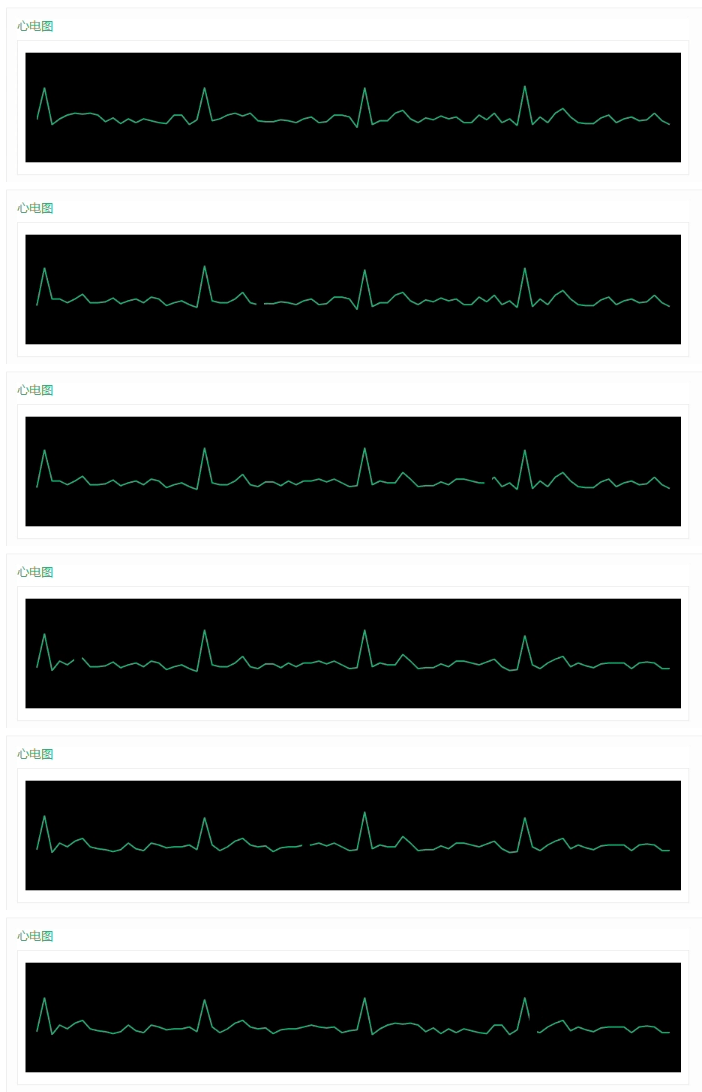
效果展示:
预览图中在第二圈时会出现卡顿现象,这是由于使用PS转视频为GIF时造成的,在实际使用中是不会出现该情况的。
难点解析:
1:数据的刷新,不能像默认的折线图一样进行无限叠加。
2:基线的实现,在波形变换的前方会有一个基线用于隔断表示数据的刷新起始点,基线要跟随数据点位同步移动。
实现原理:
数据刷新的实现:
数据的刷新是每次只更新一个点位的数据,同时又不能影响其它数据,在更新的同时还需考虑是否到边界,到边界后需要起点开始更新,可以使用循环 + 记录下标的形式实现。
let recursiveIndex = 0; // 循环下标,记录边界范围内的循环下标
let sumIndex = 0; // 总循环下标,记录当前一共循环了多少次
let boundary = 21 * 4; // 折线图最大显示数量,21的来源是我数据中实现一个完整波段效果的数据长度,这里表示最大显示4个波段

// 一个波段的数据,后续的数据是基于此进行变动的。
const soucres = [18.5, 38.5, 20, 21, 21, 22, 24.5, 22, 21, 20.5, 20.5, 20.5, 21, 21, 21, 21, 21, 20.5, 22, 21, 20];
// 原始数据,一开始的默认效果显示为4个波段
const ydata: number[] = new Array(4).fill(0).map(() => new Array(21).fill(0).map((_, i) => soucres[i] - Math.floor(Math.random() * 5))).flat(Infinity) as number[];

// 总数据,这里是用于更新波形的数据,生成了10个随机波段。
const arr = new Array(10).fill(0).map(() => new Array(21).fill(0).map((_, i) => soucres[i] - Math.floor(Math.random() * 5))).flat(Infinity);

// 每100毫秒更新一次数据
let timer = 0;
const updateEcg = () => {
  // 循环下标到到达边界后设为0从起点开始循环

  if (recursiveIndex >= boundary) recursiveIndex = 0;

  // 总循环次数到达数据末端后从起点开始
  if (sumIndex >= arr.length) sumIndex = 0;

  // 更新当前点位数据
  ydata[recursiveIndex] = arr[sumIndex] as number;
  updateValue();
  recursiveIndex += 1;
  sumIndex += 1;

  timer && clearTimeout(timer);
  timer = setTimeout(() => {
    updateEcg();
  }, 100);
};

// 更新echarts
const updateValue = () => {
  const options = myChart.getOption();

  Object.assign(options, {

    series: [{
      ...options.series[0],
      data: ydata
    }]
  });

  myChart.setOption(options, false);
};
基线的实现:
基线使用 graphic 实现,为什么要用它,因为它简单,可以很轻松的绘制出一条竖线,并设置它的样式,最重要的是可以设置层级关系和移动点位,通过不断修改它的X和Y就可以让它动起来。
// 在option中添加graphic,它与grid,series同级。
const option = {
    graphic: {
      type: "line",
      shape: {
        x1: 0,
        y1: 0,
        x2: 0,
        y2: 0
      },
      style: {
        stroke: "#000000",
        lineWidth: 10
      },
      z: 10,
    },
    ...args,
}
让基线动起来:
修改 updateValue 函数即可实现,通过不断修改横坐标就能让它跑起来。
const updateValue = () => {
  const options = myChart.getOption();

  Object.assign(options, {
    graphic: {
      ...options.graphic,
      shape: {
        // 这里的850是指画布的宽度
        x1: Math.floor(recursiveIndex * (850 / boundary)) + 10,
        y1: 0,
        x2: Math.floor(recursiveIndex * (850 / boundary)) + 10,
        // 这里表示基线的高度
        y2: 400
      }
    },
    series: [{
      ...options.series[0],
      data: ydata
    }]
  });

  myChart.setOption(options, false);
};
完整代码:
<template>
    <div class="ecgs" ref="REcg"></div>
</template>


<script setup lang="ts">
import {onMounted, ref} from "vue";
import * as echarts from "echarts";


const REcg = ref<HTMLElement>();

let recursiveIndex = 0;
let sumIndex = 0;
let boundary = 21 * 4;

const soucres = [18.5, 38.5, 20, 21, 21, 22, 24.5, 22, 21, 20.5, 20.5, 20.5, 21, 21, 21, 21, 21, 20.5, 22, 21, 20];
const ydata: number[] = new Array(4).fill(0).map(() => new Array(21).fill(0).map((_, i) => soucres[i] - Math.floor(Math.random() * 5))).flat(Infinity) as number[];
const arr = new Array(10).fill(0).map(() => new Array(21).fill(0).map((_, i) => soucres[i] - Math.floor(Math.random() * 5))).flat(Infinity);

let myChart: any;

const updateValue = () => {
  const options = myChart.getOption();

  Object.assign(options, {
    graphic: {
      ...options.graphic,
      shape: {
        x1: Math.floor(recursiveIndex * (850 / boundary)) + 10,
        y1: 0,
        x2: Math.floor(recursiveIndex * (850 / boundary)) + 10,
        y2: 400
      }
    },
    series: [{
      ...options.series[0],
      data: ydata
    }]
  });

  myChart.setOption(options, false);
};

let timer = 0;
const updateEcg = () => {
  if (recursiveIndex >= boundary) recursiveIndex = 0;
  if (sumIndex >= arr.length) sumIndex = 0;

  ydata[recursiveIndex] = arr[sumIndex] as number;
  updateValue();
  recursiveIndex += 1;
  sumIndex += 1;

  timer && clearTimeout(timer);
  timer = setTimeout(() => {
    updateEcg();
  }, 100);
};


const drawEcg = () => {
  if (!REcg.value) return;

  myChart = new echarts.init(REcg.value);
  const option = {
    backgroundColor: "#000",
    tooltip: {
      trigger: "axis",
      show: false,
    },
    grid: {
      borderWidth: 0,
      top: 10,
      left: 10,
      right: 10,
      bottom: 10,
      textStyle: {
        color: "#fff"
      }
    },
    calculable: true,
    xAxis: [{
      type: "category",
      axisLine: {
        show: false
      },
      splitLine: {
        show: false
      },
      axisTick: {
        show: false
      },
      axisLabel: {
        show: false
      },
      data: ydata,
    }],
    yAxis: [{
      type: "value",
      max: 50,
      min: 0,
      splitLine: {
        show: false
      },
      axisLine: {
        show: false
      },
      axisTick: {
        show: false
      },
      axisLabel: {
        show: false
      }
    }],
    graphic: {
      type: "line",
      shape: {
        x1: 0,
        y1: 0,
        x2: 0,
        y2: 0
      },
      style: {
        stroke: "#000000",
        lineWidth: 10
      },
      z: 10,
    },
    series: [{
      name: "心电图",
      type: "line",
      showAllSymbol: false,
      symbolSize: 0,
      smooth: false,
      lineStyle: {
        color: "#2ba471",
      },
      itemStyle: {
        borderWidth: 5,
        color: "",
      },
      data: ydata,
    }]
  };

  myChart.setOption(option);

  setTimeout(() => {
    timer && clearTimeout(timer);
    updateEcg();
  }, 1000);
};

onMounted(() => {
  drawEcg();
});
</script>
如果感觉本文对您有所帮助,请点个赞在走吧~